Internship
Renewables for Retail
An interactive dashboard to determine which bp gas stations can be turned into small-scale wind farms.
Internship
Renewables for Retail
An interactive dashboard to determine which bp gas stations can be turned into small-scale wind farms.
Internship
Renewables for Retail
An interactive dashboard to determine which bp gas stations can be turned into small-scale wind farms.


Timeline
3 months
Jun-Aug 2024
Company
Shipt
Role
Product Designer
Team
Walt, Product Manager
Katie, Data Analyst (user)
Timeline
3 months
Jun-Aug 2024
Company
Shipt
Role
Product Designer
Team
Walt, Product Manager
Katie, Data Analyst (user)
Timeline
3 months
Jun-Aug 2024
Company
Shipt
Role
Product Designer
Team
Walt, Product Manager
Katie, Data Analyst (user)
Problem
40k retail sites. How many are viable for small-scale wind farming?
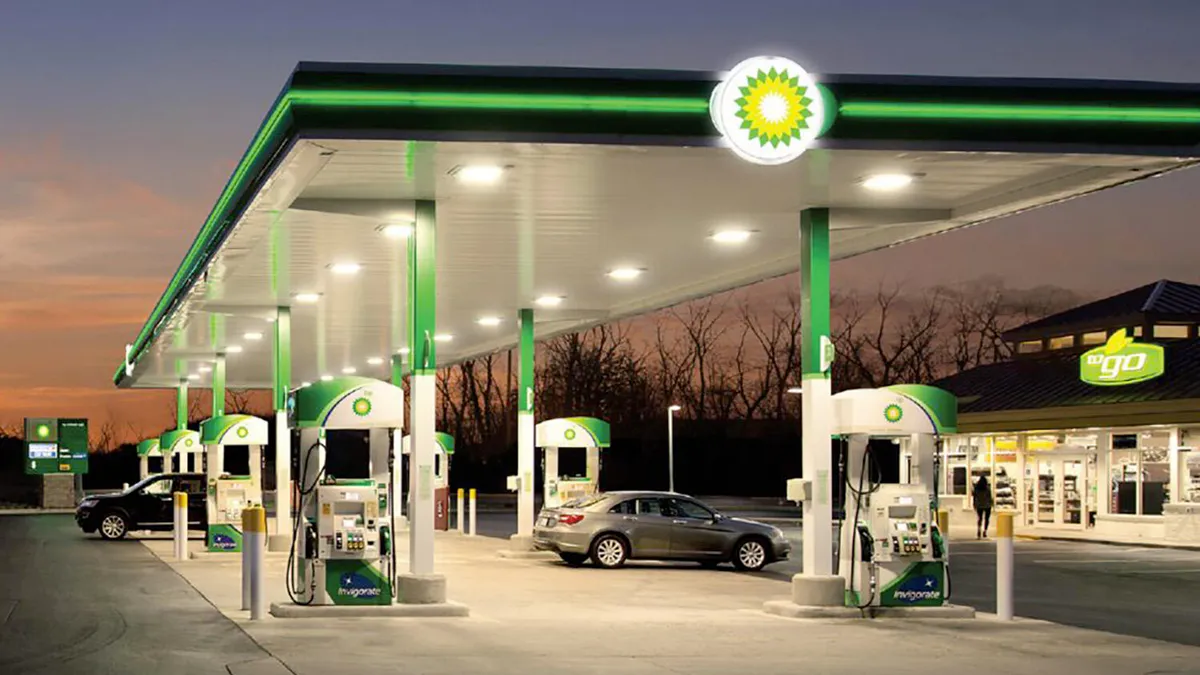
bp has tens of thousands of retail sites and wanted to harness the power of wind. Small-scale wind turbines, a promising source of energy, can help the company achieve its goal of net-zero emissions and promote sustainability. But where is the best place to start piloting these turbines?


Design Question
How might we decide which gas stations to turn into wind farms?
How might we decide which gas stations to turn into wind farms?
How might we decide which gas stations to turn into wind farms?
Solution
A digital tool that displays viability metrics and other strategic data


user stories
3 unique user needs.
user stories
3 unique user needs.
user stories
3 unique user needs.
💰
Decision Maker
"I want to know the ROIs for each site so that I can know which sites will be the most viable financially."
💰
Decision Maker
"I want to know the ROIs for each site so that I can know which sites will be the most viable financially."
💰
Decision Maker
"I want to know the ROIs for each site so that I can know which sites will be the most viable financially."
⚙️
Wind Engineer
"I want to know the weather conditions each site so that I can know which sites will have the best for generating wind power."
⚙️
Wind Engineer
"I want to know the weather conditions each site so that I can know which sites will have the best for generating wind power."
⚙️
Wind Engineer
"I want to know the weather conditions each site so that I can know which sites will have the best for generating wind power."
📊
Strategic Planner
"I want to know the lot size and see what the landscape is near the site so that I can determine the ease of building a turbine at the site."
📊
Strategic Planner
"I want to know the lot size and see what the landscape is near the site so that I can determine the ease of building a turbine at the site."
📊
Strategic Planner
"I want to know the lot size and see what the landscape is near the site so that I can determine the ease of building a turbine at the site."
wireframes
Getting our ideas on paper
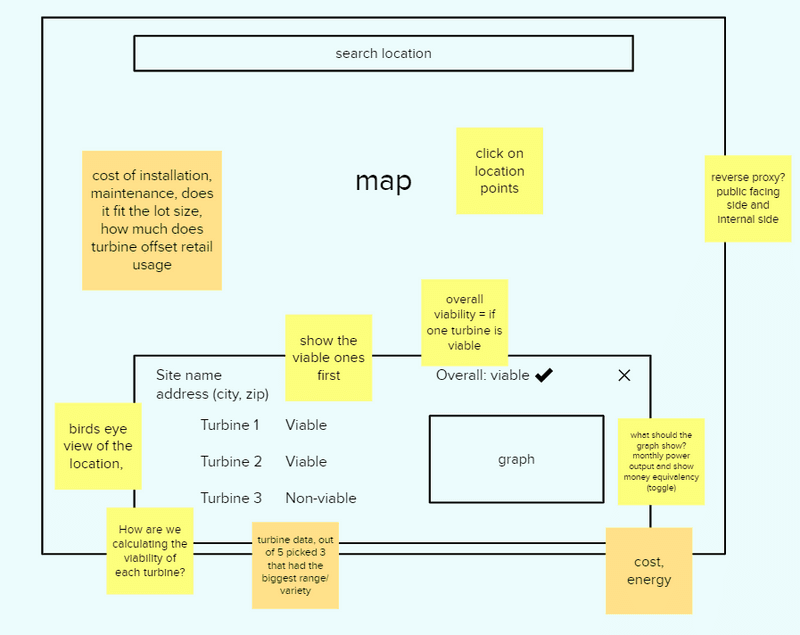
The key features we wanted to include that would align with users' needs:Search functionA map with all retail site locationsViability metricThese features would give the user an easy way to make sense of the data.
wireframes
Getting our ideas on paper
The key features we wanted to include that would align with users' needs:Search functionA map with all retail site locationsViability metricThese features would give the user an easy way to make sense of the data.
wireframes
Getting our ideas on paper
The key features we wanted to include that would align with users' needs:Search functionA map with all retail site locationsViability metricThese features would give the user an easy way to make sense of the data.
prototype 1
Building our React prototype.
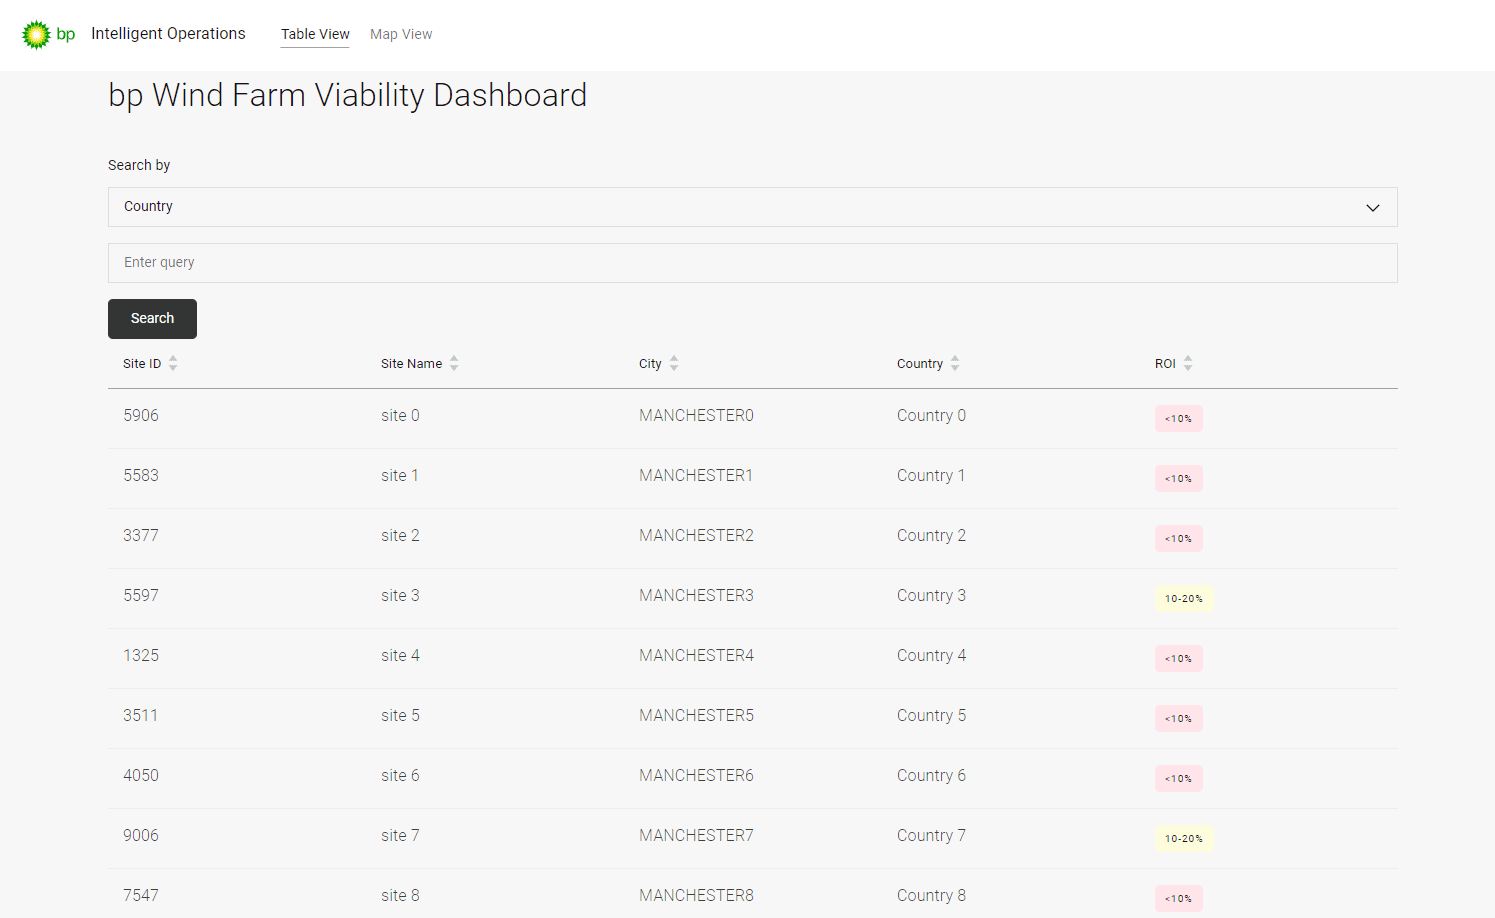
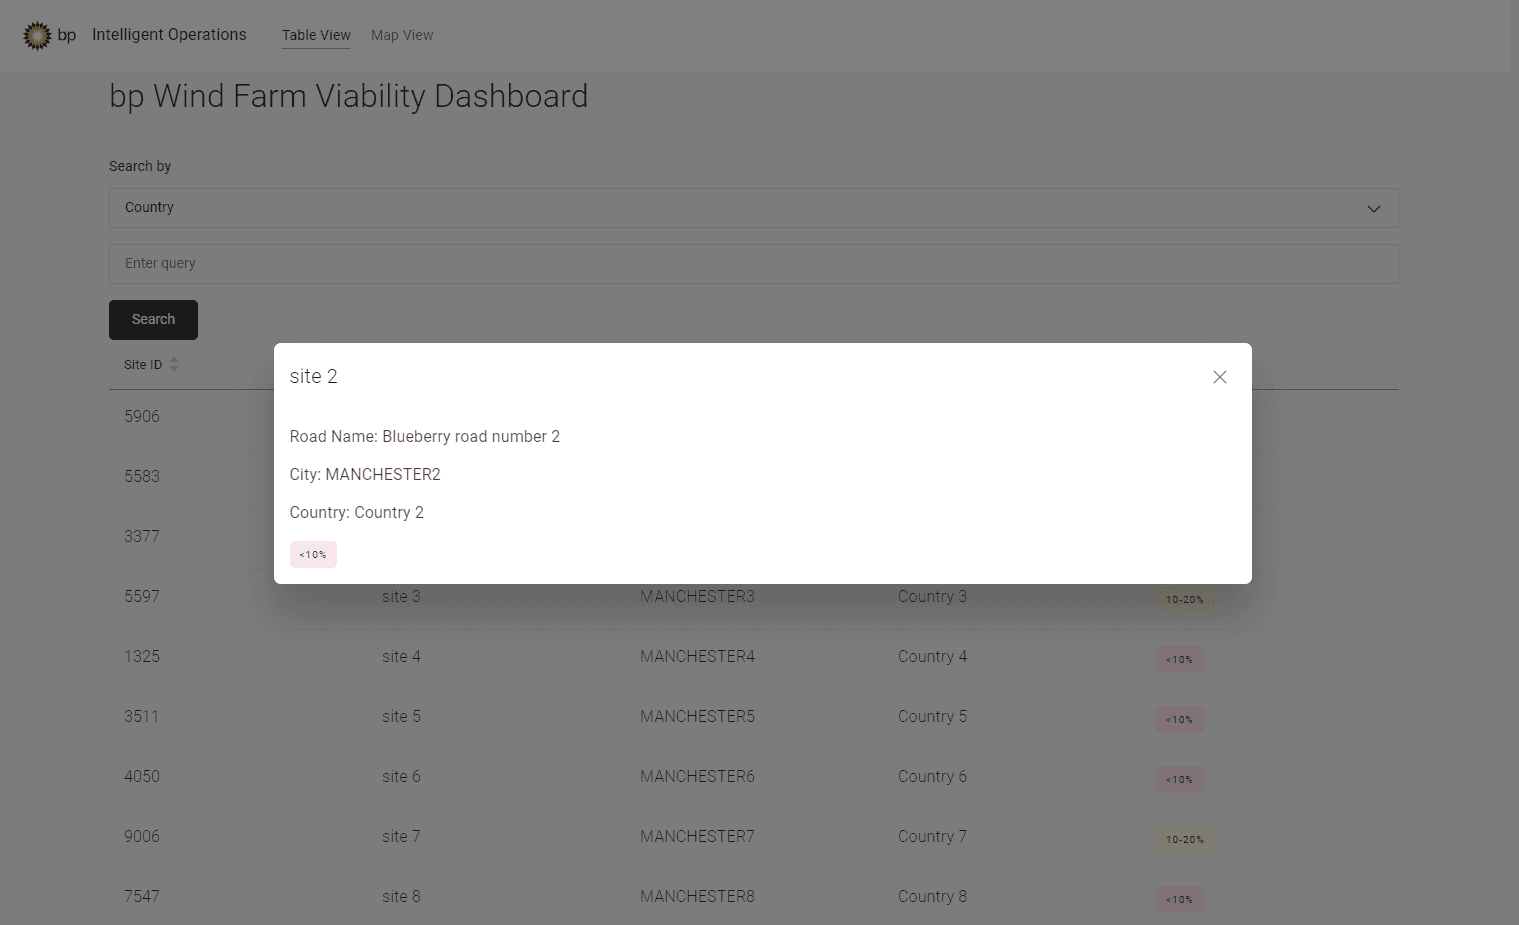
Our first prototype was a full-stack application. I developed the front-end using bp's own component library to maintain brand consistency.
Some key features:
Search bar
Table
ROI viability metric
Having a table with all the retail sites displayed with the viability metric would be sufficient for the MVP. It's a straightforward view of the data.




Prototype 2
Prototyping in PowerBI
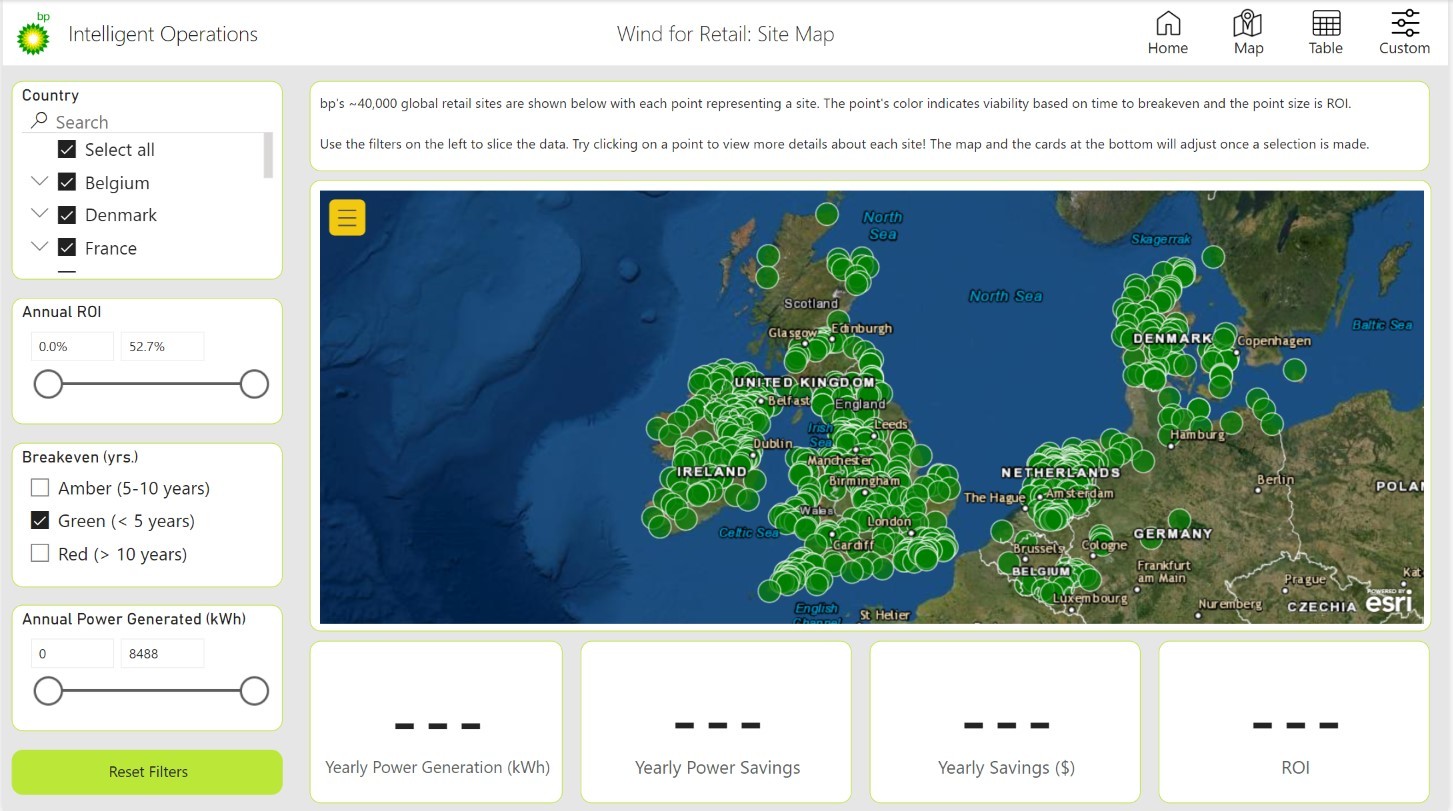
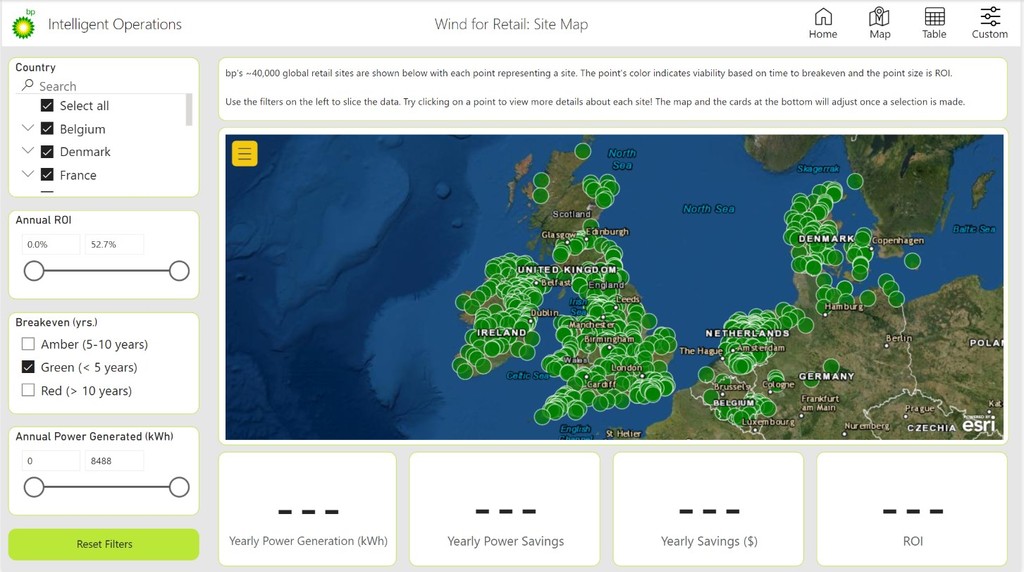
Due to time constraints and after receiving management feedback, we decided to pivot to creating our application in PowerBI.
Prototype 2
Prototyping in PowerBI
Due to time constraints and after receiving management feedback, we decided to pivot to creating our application in PowerBI.
Prototype 2
Prototyping in PowerBI
Due to time constraints and after receiving management feedback, we decided to pivot to creating our application in PowerBI.
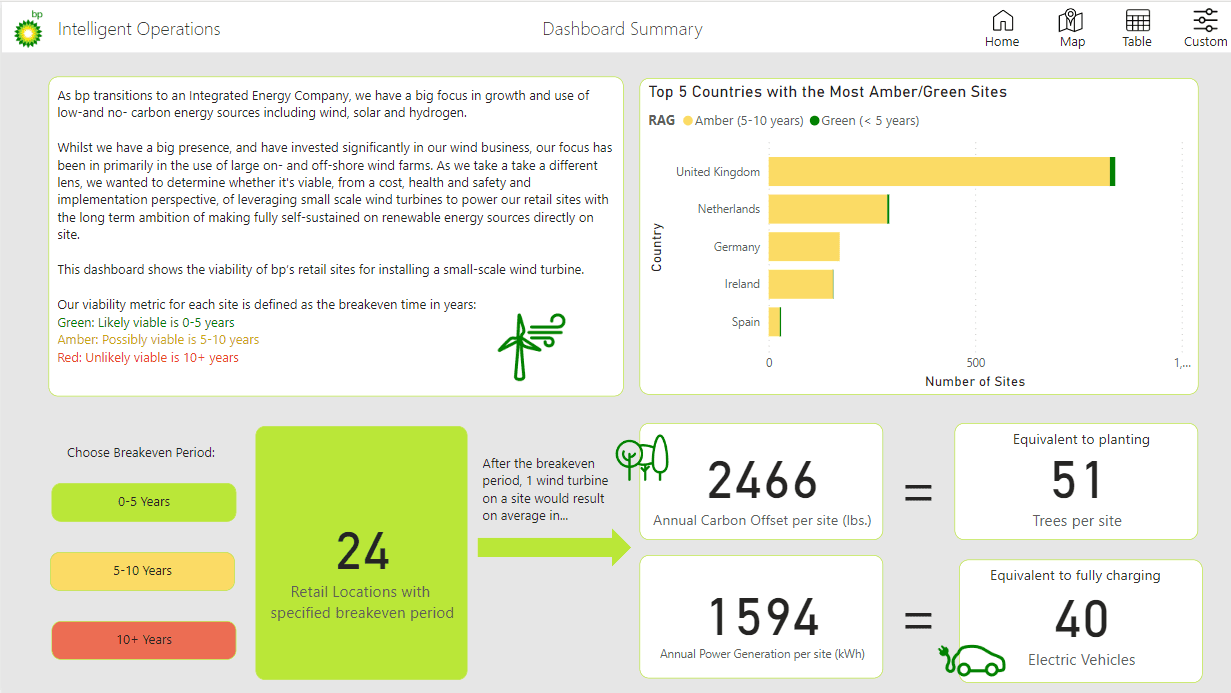
Summary page
Goal
Inform users of the most important information for decision making.
Solution
Highlight the number of the sites that have “green” viability and the countries with the highest number of viable sites.
Summary page
Goal
Inform users of the most important information for decision making.
Solution
Highlight the number of the sites that have “green” viability and the countries with the highest number of viable sites.
Summary page
Goal
Inform users of the most important information for decision making.
Solution
Highlight the number of the sites that have “green” viability and the countries with the highest number of viable sites.


Map view
Goal
Have a visual representation of retail sites.
Solution
Show the locations of each retail site as well as metrics like ROI and yearly power generation (kWh).
Map view
Goal
Have a visual representation of retail sites.
Solution
Show the locations of each retail site as well as metrics like ROI and yearly power generation (kWh).
Map view
Goal
Have a visual representation of retail sites.
Solution
Show the locations of each retail site as well as metrics like ROI and yearly power generation (kWh).


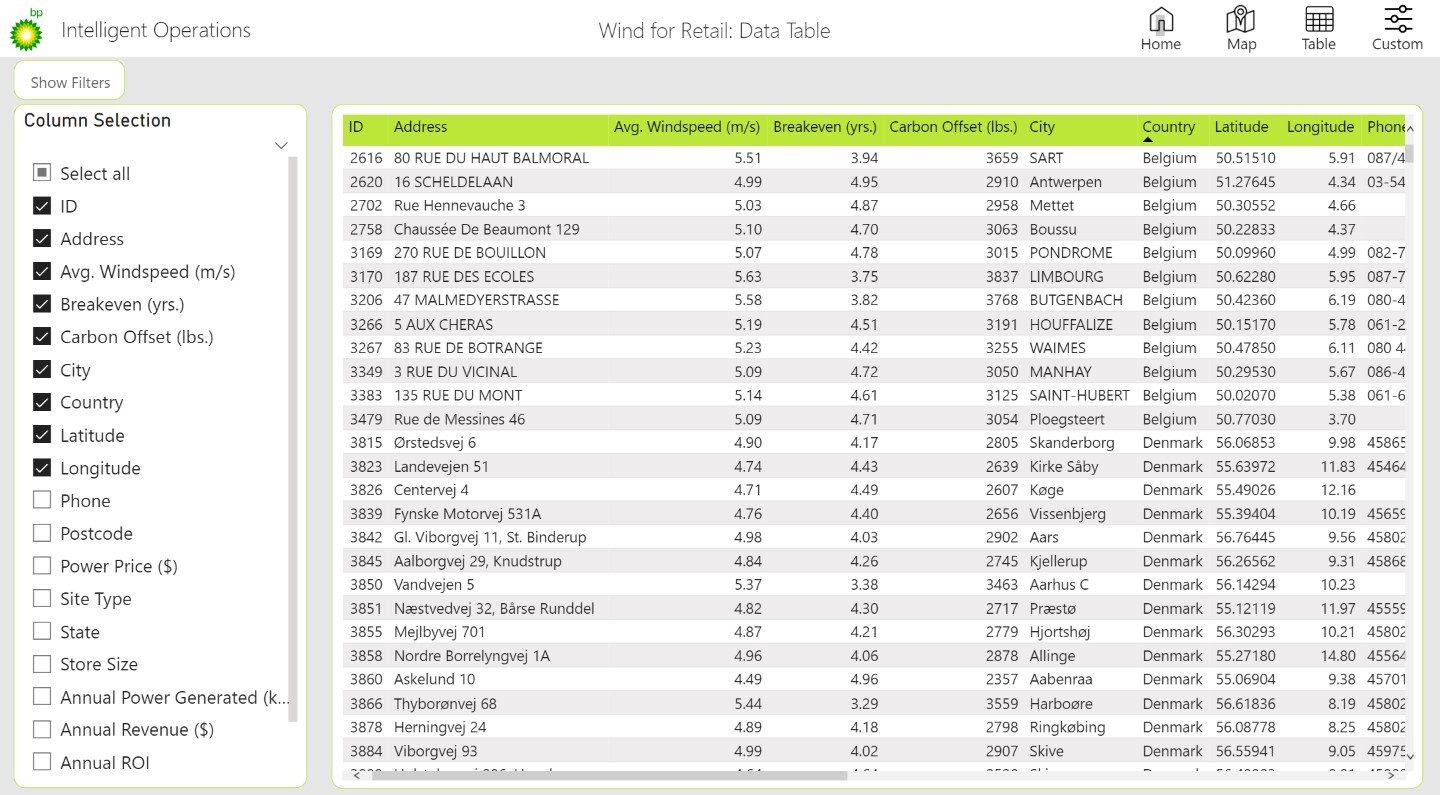
Table view
Goal
Users may want to explore data more in depth.
Solution
Provide a table view to view the raw numbers for each site.
Table view
Goal
Users may want to explore data more in depth.
Solution
Provide a table view to view the raw numbers for each site.
Table view
Goal
Users may want to explore data more in depth.
Solution
Provide a table view to view the raw numbers for each site.


Reflection
Learning by doing.
Challenges
My lack of technical skills. I had never used React or worked with engineers before. However, my team was supportive and helped me pick up React quickly.
Difficulty identifying our users. Since we were designing an internal tool, I wasn’t sure who to engage with which made it difficult to envision the user journey. Next time, I would try to spend more time conducting user research to gain a clearer idea of our project requirements.
Successes
Had fun learning with my teammates and working on a real-world problem, especially focused on sustainability.
Leveraged different skills like research, front-end development, working on a diverse team, and the user-centered design process to create a useful solution addressing a business problem.
